Snapshot
- 458 Total Individual Vanderbilt Submitters
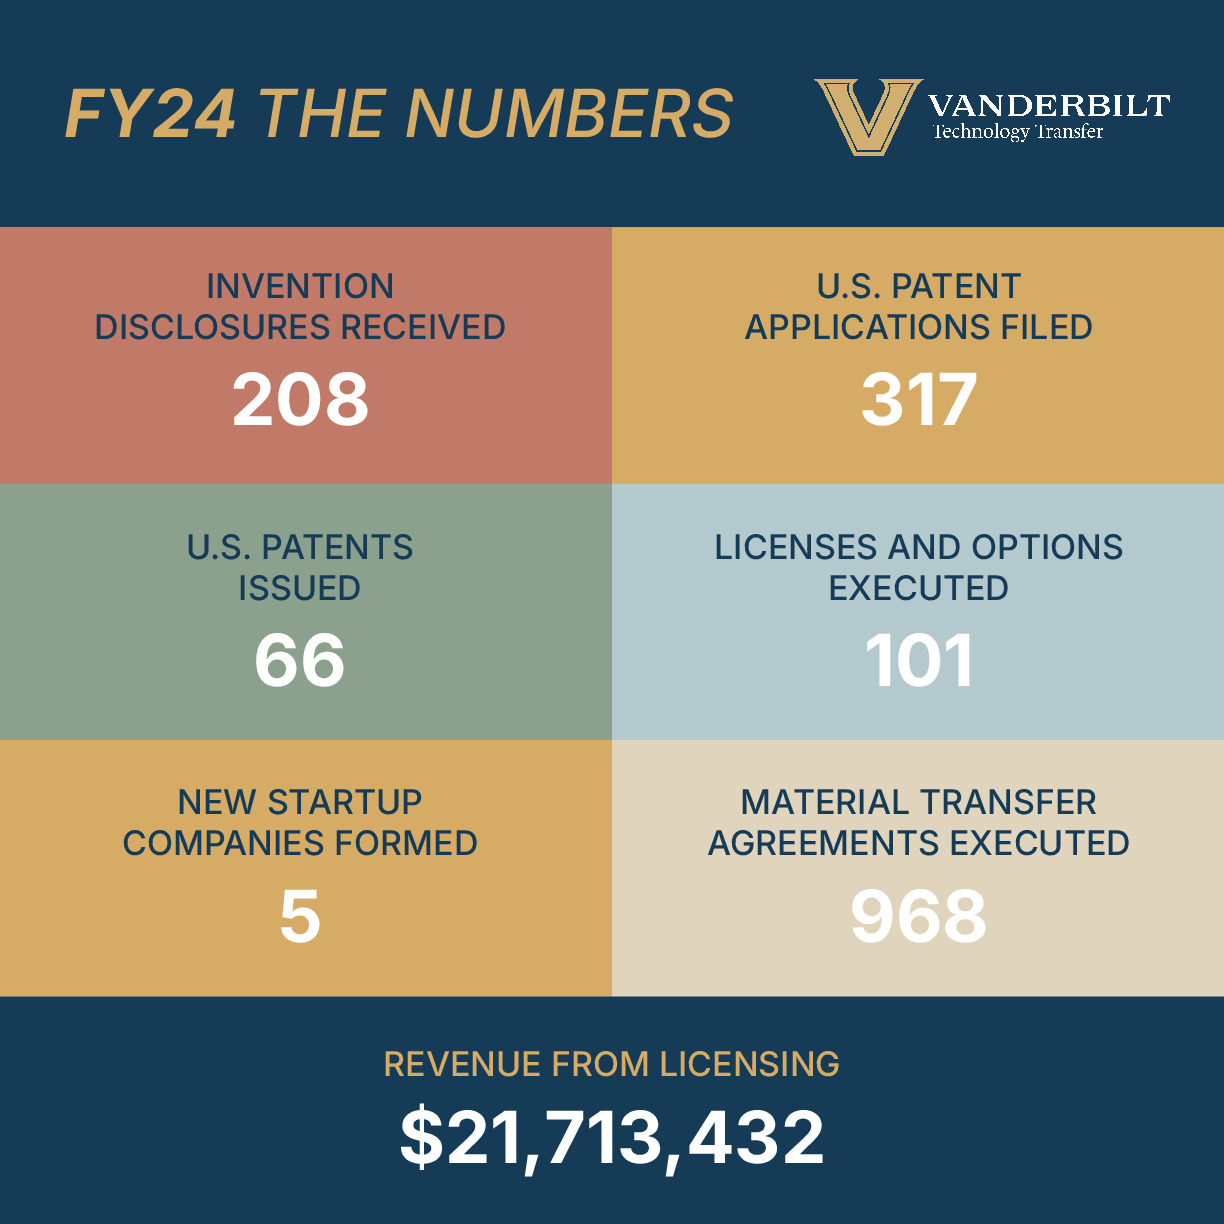
- 317 U.S. Patent Applications Filed
- 66 U.S. Patents Issued
- 101 Licenses and Options Executed
- 80 Depts, Centers, Institutes Represented by Vanderbilt Submitters
- $21.7M Revenue Generated
Current Highlights
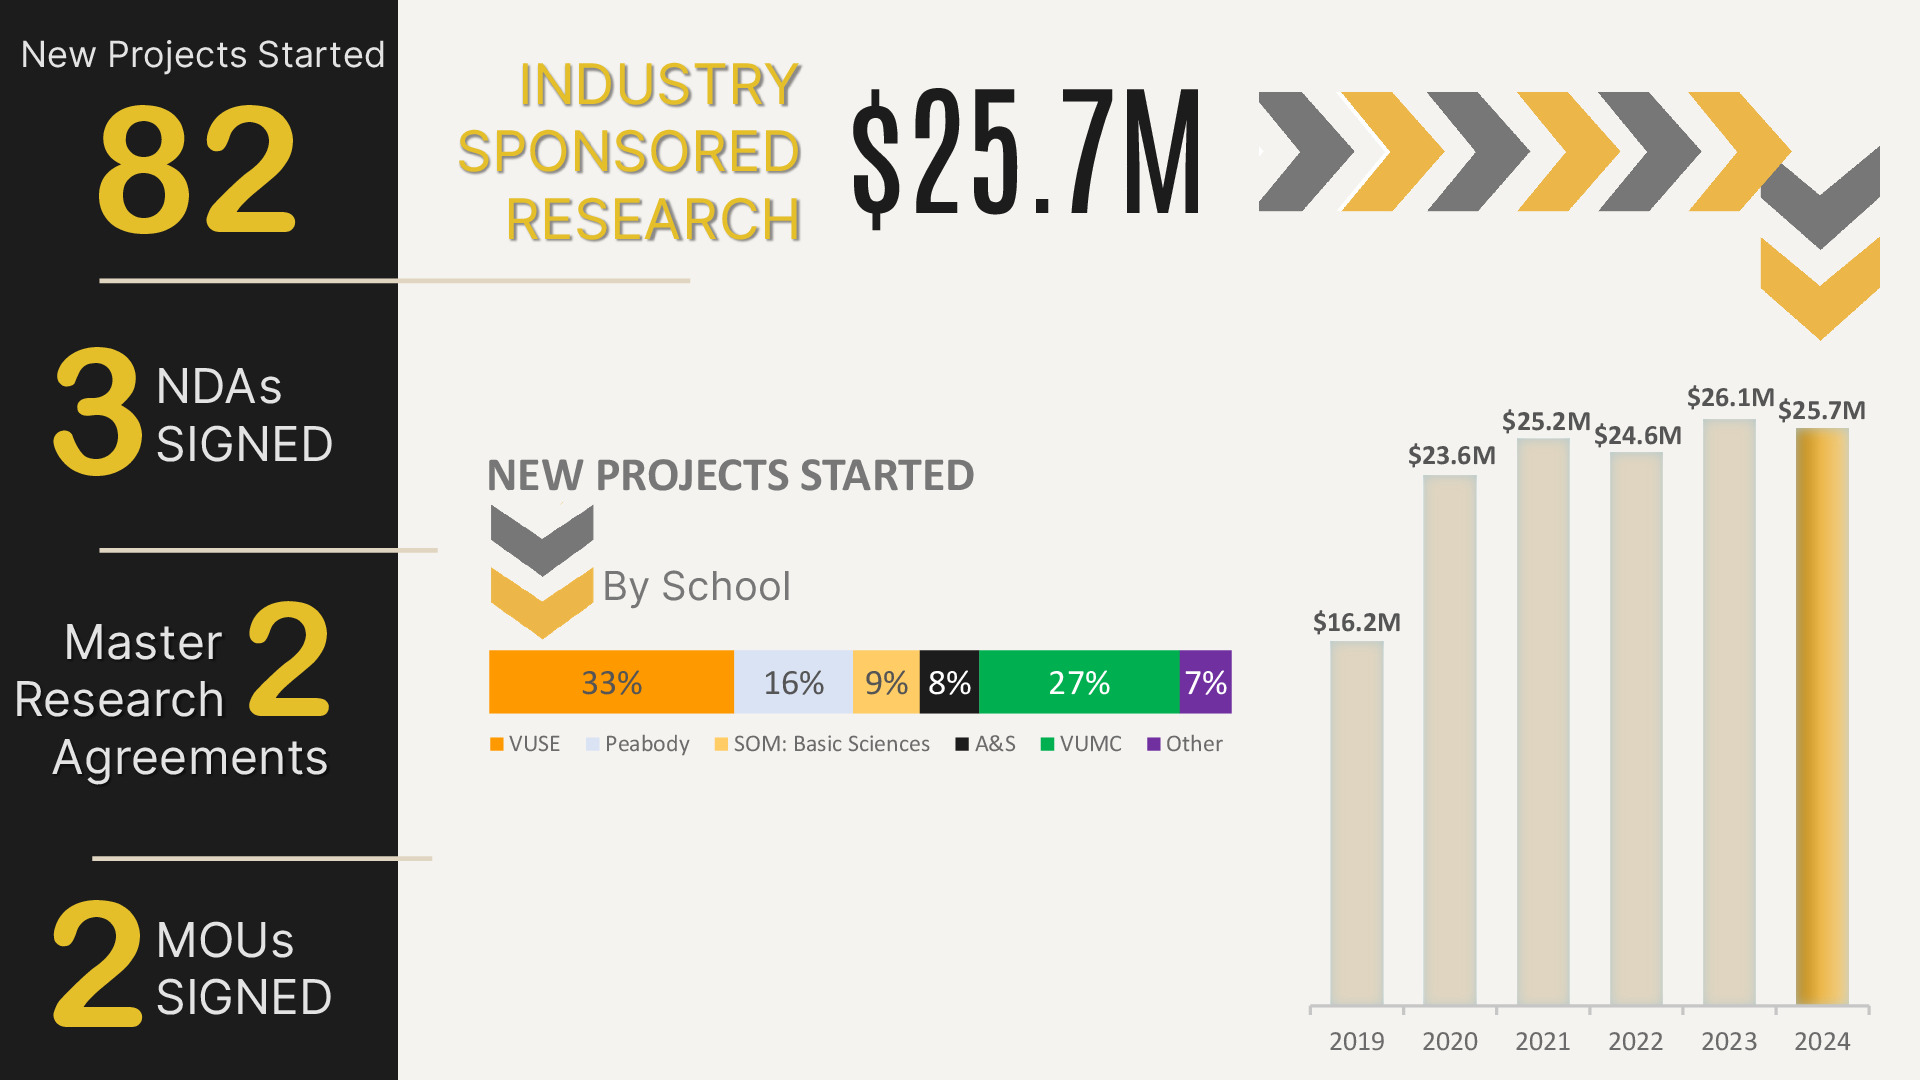
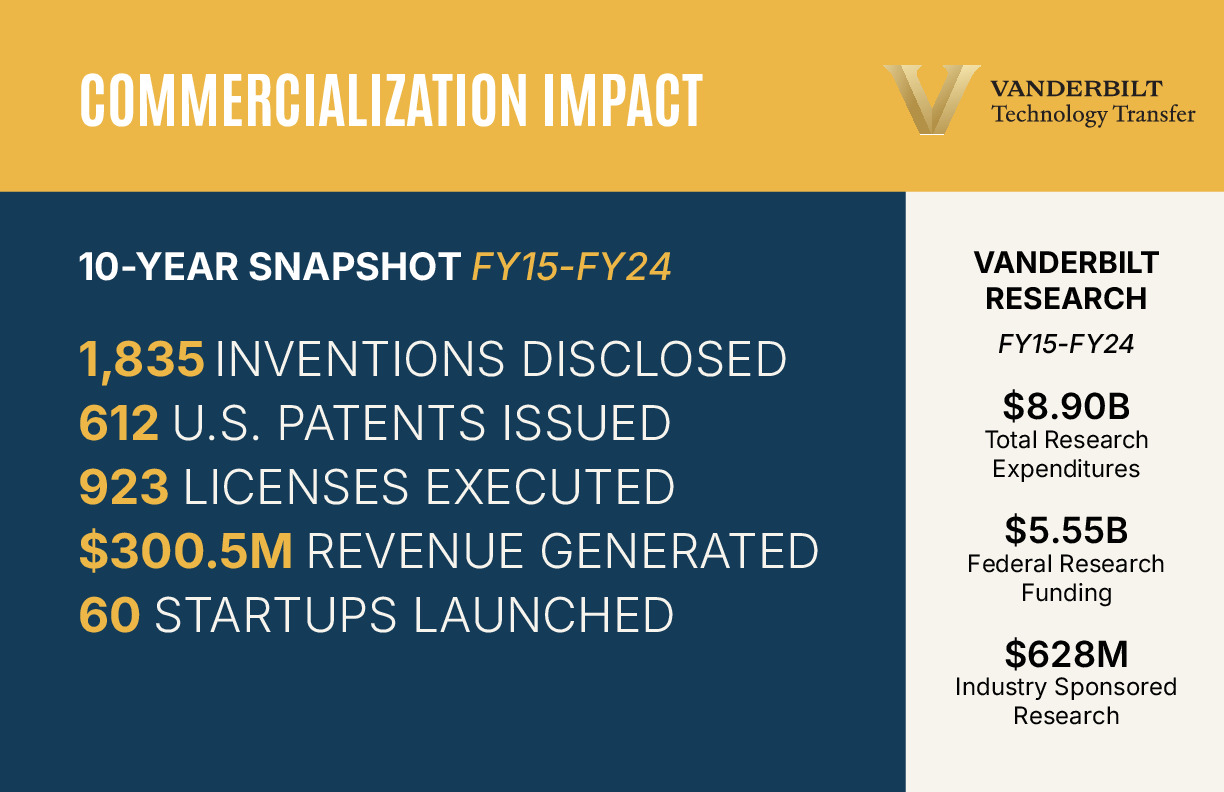
In the fiscal year summaries below, we have highlighted several key statistics that have had a measurable impact on the Vanderbilt community and our innovators over the past twelve months. CTTC continues to see record growth across many of our metrics while continuing to seek out new ways to bring services and support to our researchers and the Vanderbilt community throughout.


